Introduction - Healthy/Unhealthy Classification first approach with spectrogram
Why using Deep Learning
Artificial Intelligence becomes very popular these day and Deep Learning is one powerful technique which is used a lot ( and might dominate all others techniques in the near future )
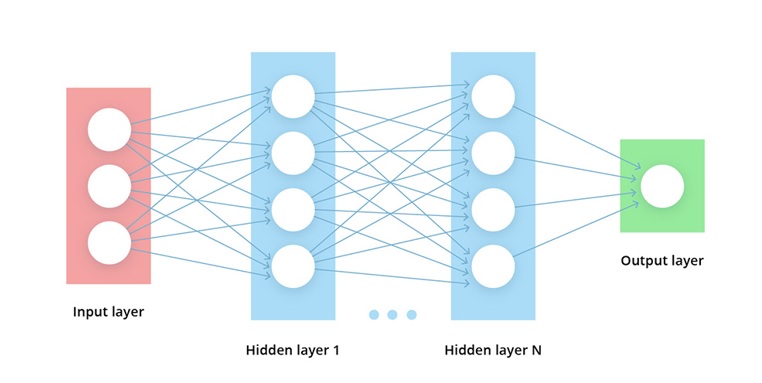
It is a subset of Neural Networks ( a computing systems which is insprired by biological neural networks ). And by stacking a lot of Neural Networks layers, we will get a Deep Learning model which might contains multiple billions parameters and is capable of handle very complicated problems that no classical algorithm can be effective.
 |
|---|
| Deep learning model (src: databricks.com) |
Deep Learning is especially powerful with unstructrured data (Image, Text, Sound, Video, …). For example with around 10 lines of code and you will get a model with 99.5% accuracy in Cat/Dog classification, ex: Cats vs Dogs - fastai tutorial)
In this blog post, I will talk about my first approach to deal with Healthy/Unhealthy lung sound classification. In brief, I will firstly, convert audio signal to image, then using an existing image-classification and fine-tuning with this set of audio-images
Lung sound Introduction
Using stethoscope is the very first technique a doctor use to diagnose patient’s lung health.
Below is some samples about healthy/unhealthy lung sounds:
From my limited knowledge, normal lung sound is kind of smoothly, low-pitched sound, in contrast with unhealthy lung sound, which is wheezing or high-pitched sound.
Because of the reputation of effectiveness using Deep Learning for Classifying Image. My first approach for this project is converting the audio file to image then using some well-known model and fine-tuning with the new data.
Representation of Sound and Spectrogram
Sound is the pressure of air propagates to our ear. Digital audio file is gotten from a sound sensor that can detects sound waves and converting it to electrical signals.
 |
|---|
| Raw sound signal (src: Wikipedia) |
However, it is not very intuitive for us to feel this kind of representation. For us, as human, we sense a sound not only on a particular time by its intensity, but also by its pitch. The pitch is the frequency of the sound - higher pitch corresponding to higher frequency and vice versa. So, to have a representation which is closer to our brain, we can add another dimension - the frequency - to our representation, which is the Spectrogram.
 |
|---|
| Spectrogram (src: Wikipedia) |
From the picture above, we have an image that represents a sound. X-axis is for time, y-axis is for frequency and the color is for intensity
We can use this image as input to a well-known Convolutional Neural Network (CNN) - Resnet model - to classify the health’s state or lung.
Result
The dataset you can find on Kaggle Respiratory-sound-database, which has 920 sound files.
To obtain a model, you can take a look at my code on Kaggle starter kernel Lung Sound Classification. In it, I describe everthing from preprocessing the dataset, dealing with unbalance dataset and how to train model using fast.ai library.
 |
|---|
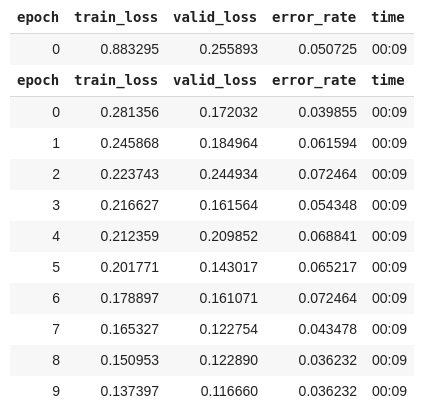
| Result of training |
The result of fine-tuning model, you can find in the image above. After about 90 seconds, we get a model with 3.6% error rate on validation set.
Because the dataset is still small with only 126 patients. I think this result can not guarantee working yet. But after the Covid-19 pandemic, I believe this idea can somehow helping people. I will try to elaborate the idea, so stay tune.